Turbines & Ontario’s wind patterns
“Wind and solar energies can be developed but they are very dilute, they produce only small amounts of energy, at great expense, and their production is highly variable. These energies are not only expensive but they are incapable of meeting the vast requirements of our industrial society.”
James Lovelock, the pioneer of environmental thinking and global warming alarmist
Wind in Ontario
The timing of energy produced from wind projects is out of step or the opposite with Ontario’s needs for electricity. When Ontario’s electricity needs are at its peak, there’s no wind. When Ontario’s electricity needs are at its lowest, the wind blows.
- In Southwestern Ontario, as an example, the lowest wind occurs in the summer and the highest is in the spring, autumn and winter. Also the wind blows more strongly at night and less during daylight.
- However, Ontario requires most of its electricity during the day and less at night.
Ontario requires more electricity in the summer and less in spring and autumn and winter.
Using wind energy in Ontario is like putting a square peg in a round hole. On a hot summer day when we all need our air conditioners, there’s no wind and therefore Wind Farms can’t produce the electricity we need. On a cold winter day, when the wind is blowing, we use gas heat and much less electricity.
We are headed for rolling blackouts
Ontario has gas and nuclear plants on standby as backup to the unreliable wind energy.. These plants are continually in “stop and go” mode to accommodate the fluctuation in wind.
However, gas plants require 4 to 24 hours for start up, nuclear is 3 days. Since a complete loss of wind cannot be restored immediately; the result will be rolling blackouts.
The Inefficiency of Wind Energy in Ontario
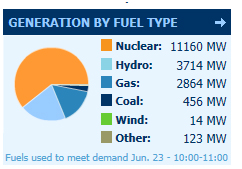
The Independent Electricity System Operator (IESO) states that in Ontario an IWT produces 14-40% of its potential energy fuel 9. Their statistics show that an average IWT will remain idle 60 to 86% of the time due to insufficient wind in Ontario.
However, IESO’s website shows, in real time, energy fuel produced from wind, and there are many occasions when the production is less than 1% (not 14%).
The chart below shows the province’s fuel energy resources on June 23, 2012 at 11am. On that day, there were 890 IWT’s in use with the potential of generating 1580 MW. (if the wind blows at high wind speeds.) However, the total generated MW from almost no wind was 14 MW of power which is 0.88% (less than 1%) of their capacity.
On July 9, 2012, at 12 pm, the total energy fuel from IWT’s was 16 MW.
Please read the article below that was written by Steve Alpin regarding the performance of all energy sources during the latest heat wave. Mr. Alpin specializes in Energy and Environmental Issues.
http://canadianenergyissues.com/2012/07/10/ontario-nuclear-performance-in-the-recent-heat-wave/
You may check the efficiency of IWT’s in real time at http://www.ieso.ca/
Geographical Wind Comparison
Texas is one of the front runners utilizing wind farms.
- Texas’ access to hydroelectricity is limited, therefore it resorts to wind energy
- Texas has “very good and high wind speeds” across the entire state. (7.5+ metres per second at a height of 80 metres)
- Because of the vast open landscape, Wind Farms were built in remote areas where they have minimal impact on human and animal life.
- Communities have a say in the placement of wind farms.
- Wind Prices are cheap because of limited government involvement and therefore the competition among Wind Energy Companies
- Even with their high wind speeds,Texas is still prone to black outs.
http://www.reuters.com/article/2008/02/28/us-utilities-ercot-wind-idUSN2749522920080228
http://energy.aol.com/2011/05/20/the-answer-may-not-be-blowing-in-the-wind/
This map demonstrates the “high wind speeds” across Texas. On this page, please click on the map to obtain a better view.
http://www.windpoweringamerica.gov/wind_resource_maps.asp?stateab=tx
Ontario’s Opposite approach
- Ontario land has only “acceptable” wind speeds and only in certain areas. (6.0 to 7.5 metres per second at a height of 80 metres),
- Wind Farms must surround our population, and communities have no say.
- Wind energy prices are excessive as the rates are set by the government. There is no incentive for lower pricing.
- Because our land wind speeds are only acceptable, bigger IWT’s (some 600 ft high) and additional wind farms must be built in congestive areas to make use of our wind for energy.
- By relying on wind, at some point Ontario will have to resort to off-shore wind farms to take advantage of winds speeds of 7.5 or greater.
This map demonstrates in Ontario which areas are considered as only “Acceptable”.
http://www.mnr.gov.on.ca/stdprodconsume/groups/lr/@mnr/@renewable/documents/document/198058.pdf
Trendy or Tried and True?
Wind and Solar power are the darlings of the Greens. After all, just about every country in Europe looks to Wind and Solar to replace fossil fuel despite the high costs and subsidies that drive it. Surely it is the future.
The irony here is that our province of Ontario is surrounded by large bodies of water that provide a greener, cleaner and more reliable alternative … the energy produced by hydro electric (water) power. Why have other regions of the world ignored and not embraced it? … because no other region of the world is blessed with an abundance of this natural resource to take advantage of it.
Perhaps the Greens are chasing Wind and Solar because it is new and trendy, while all the while there are clean, renewable, reliable, and less expensive Hydro Electric Power alternatives right in front of us. Greener alternatives that do not blight the landscape, and can be easily controlled for excess and under-generation conditions.
Consider the Hoover Dam has made the southwestern US desert regions habitable. If the Greens are so adamant about the superiority of Wind and Solar, why aren’t they pushing for replacement of this icon of power generation with wind and solar?
32,279 total views

